DockerCon 2017: Tweet Analysis
Ben Anderson (b.anderson@soton.ac.uk @dataknut)
Last run at: 2017-05-12 16:57:41
## [1] "Loading the following libraries using lb_myRequiredPackages: data.table"
## [2] "Loading the following libraries using lb_myRequiredPackages: lubridate"
## [3] "Loading the following libraries using lb_myRequiredPackages: ggplot2"
## [4] "Loading the following libraries using lb_myRequiredPackages: readr"
## [5] "Loading the following libraries using lb_myRequiredPackages: plotly"
## [6] "Loading the following libraries using lb_myRequiredPackages: knitr"
1 Purpose
To extract and visualise tweets and re-tweets of #dockercon for 17 - 21 April, 2017 (DockerCon17).
Borrowing extensively from http://thinktostart.com/twitter-authentification-with-r/
We used the Twitter search API to extract ‘all’ tweets with the #dockercon hashtag. As the Twitter search API documentation (sort of) makes clear this may not be all such tweets but merely the most relevant (whatever that means) from within a sample (whatever that means).
“It allows queries against the indices of recent or popular Tweets and behaves similarly to, but not exactly like the Search feature available in Twitter mobile or web clients, such as Twitter.com search. The Twitter Search API searches against a sampling of recent Tweets published in the past 7 days.” https://dev.twitter.com/rest/public/search, Accessed 12/5/2017
It is therefore possible that not quite all tweets have been extracted although it seems likely that we have captured most human tweeting which was our main intention. Future work should instead use the Twitter streaming API.
2 Load Data
Data should have been already downloaded using collectData.R. This produces a data table with the following variables (after some processing):
##  [1] "text"             "favorited"        "favoriteCount"
##  [4] "replyToSN"        "created"          "truncated"
##  [7] "replyToSID"       "id"               "replyToUID"
## [10] "statusSource"     "screenName"       "retweetCount"
## [13] "isRetweet"        "retweeted"        "longitude"
## [16] "latitude"         "location"         "language"
## [19] "profileImageURL"  "createdLocal"     "obsDateTimeMins"
## [22] "obsDateTimeHours" "obsDateTime5m"    "obsDateTime10m"
## [25] "obsDateTime15m"   "obsDate"          "isRetweetLab"
The table has 7,975 tweets (and 11,285 re-tweets) from 6,429 tweeters between 2017-04-16 19:01:03 and 2017-04-21 09:54:11 (Central District Time).
3 Analysis
3.1 Tweets and Tweeters over time
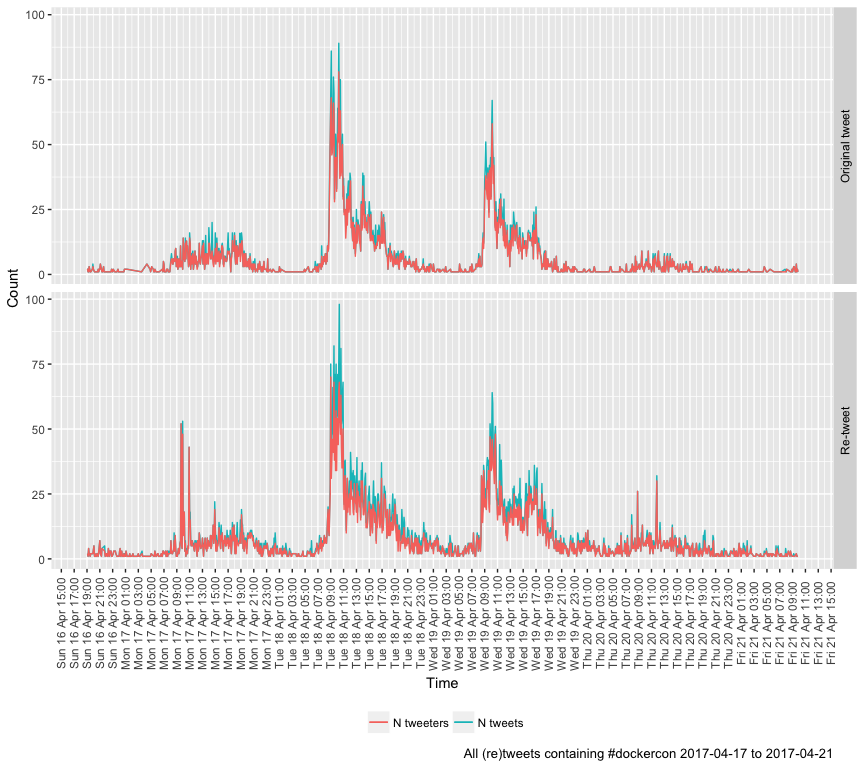
All (re)tweets containing #dockercon 2017-04-17 to 2017-04-21
3.1.1 Day 1 - Monday (Workshops)
This plot is zoomable - try it!
All (re)tweets containing #dockercon Monday 17th April 2017
3.1.2 Day 2 - Tuesday (Main Day 1)
This plot is zoomable - try it!
All (re)tweets containing #dockercon Tuesday 18th April 2017
3.1.3 Day 3 - Wednesday (Main Day 2)
This plot is zoomable - try it!
All (re)tweets containing #dockercon Wednesday 19th April 2017
3.1.4 Day 4 - Thursday (Main Day 3)
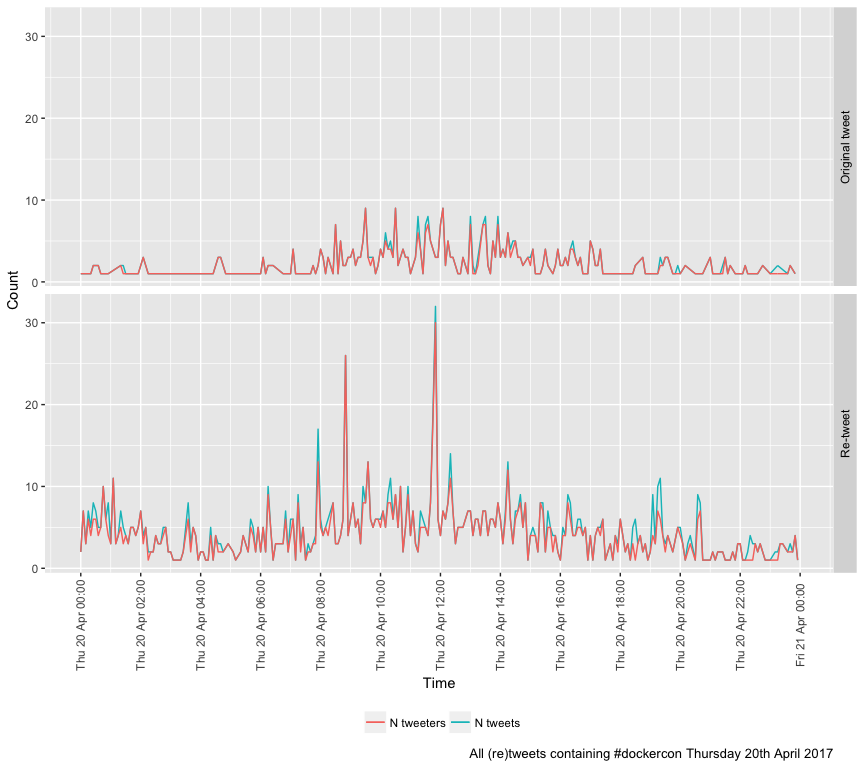
All (re)tweets containing #dockercon Thursday 20th April 2017
3.2 Location (lat/long)
We wanted to make a nice map but sadly we see that most tweets have no lat/long set.
| latitude | longitude | nTweets |
|---|---|---|
| NA | NA | 19205 |
| 30.26416397 | -97.73961067 | 2 |
| 30.26857 | -97.73617 | 1 |
| 30.2625 | -97.7401 | 31 |
| 30.26470908 | -97.7417368 | 1 |
| 30.20226566 | -97.66722505 | 1 |
| 42.36488267 | -71.02168356 | 1 |
| 37.61697678 | -122.38427689 | 1 |
| 30.2672 | -97.7639 | 3 |
| 30.2635554 | -97.7399303 | 1 |
| 30.2591 | -97.7384 | 1 |
| 30.26622515 | -97.74327721 | 1 |
| 30.26037 | -97.73848 | 3 |
| 30.258201 | -97.71264 | 1 |
| 30.25888 | -97.73841 | 2 |
| 30.259714 | -97.73940054 | 1 |
| 30.26006 | -97.73813 | 1 |
| 30.26006 | -97.73859 | 1 |
| 30.26036009 | -97.73848483 | 1 |
| 30.20243954 | -97.66718069 | 1 |
3.3 Location (textual)
This appears to be pulled from the user’s profile although it may also be a ‘guestimate’ of current location.
Top locations for tweets:
| location | nTweets |
|---|---|
| NA | 2968 |
| San Francisco, CA | 1333 |
| San Francisco | 539 |
| Austin, TX | 344 |
| Seattle, WA | 245 |
| Silicon Valley, CA | 228 |
| Paris | 191 |
| Islamabad, Pakistan | 149 |
| London | 142 |
| New York, NY | 129 |
| Charlotte, NC | 121 |
| San Jose, CA | 121 |
| Boston, MA | 112 |
| USA | 108 |
| Boulder, CO | 107 |
Top locations for tweeters:
| location | nTweeters |
|---|---|
| NA | 1195 |
| San Francisco, CA | 182 |
| Austin, TX | 89 |
| San Francisco | 61 |
| Seattle, WA | 52 |
| New York, NY | 45 |
| Paris | 45 |
| San Jose, CA | 42 |
| London, England | 37 |
| Paris, France | 36 |
| London | 33 |
| Palo Alto, CA | 31 |
| New York | 29 |
| France | 29 |
| Boston, MA | 28 |
3.4 Screen name
Next we’ll try by screen name.
Top tweeters:
| screenName | nTweets |
|---|---|
| DockerCon | 335 |
| theCUBE | 187 |
| BettyJunod | 148 |
| jpetazzo | 129 |
| climbingkujira | 127 |
| solomonstre | 126 |
| jeanepaul | 104 |
| ManoMarks | 99 |
| kaslinfields | 94 |
| OpenShiftNinja | 89 |
| vmblog | 86 |
| sitspak | 85 |
| SFoskett | 82 |
| jameskobielus | 77 |
| stefscherer | 75 |
And here’s a really bad visualisation of all of them tweeting over time! Each row of pixels is a tweeter (the names are illegible) and a green dot indicates a few tweets in the 5 minute period while a red dot indicates a lot of tweets.
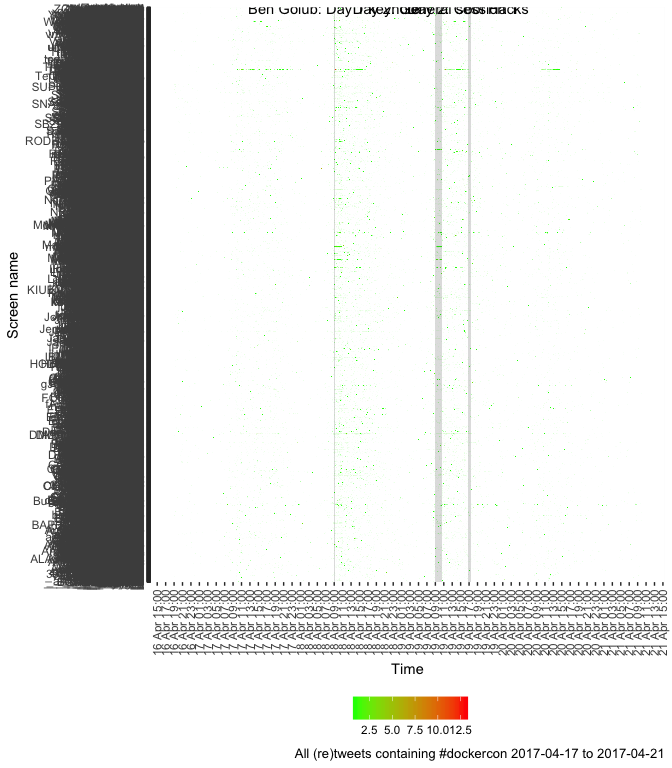
N tweets per 5 minutes by screen name
So let’s re-do that for the top 50 tweeters so we can see their tweetStreaks!
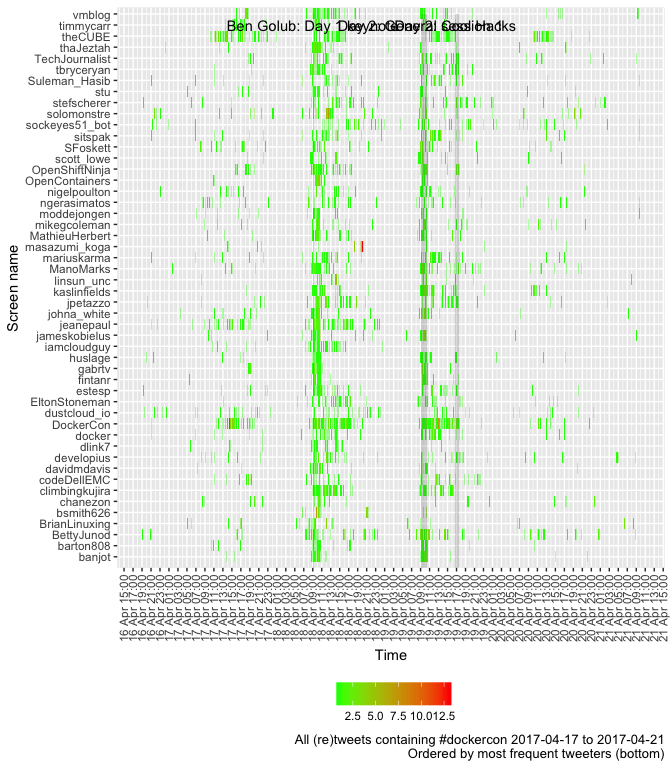
N tweets per 5 minutes by screen name (top 50, most prolific tweeters at bottom)
4 About
Analysis completed in: 51.2 seconds using knitr in RStudio with R version 3.4.0 (2017-04-21) running on x86_64-apple-darwin15.6.0.
A special mention must go to twitteR (Gentry, n.d.) for the twitter API interaction functions and lubridate (Grolemund and Wickham 2011) which allows timezone manipulation without too many tears.
Other R packages used:
- base R - for the basics (R Core Team 2016)
- data.table - for fast (big) data handling (Dowle et al. 2015)
- readr - for nice data loading (Wickham, Hester, and Francois 2016)
- ggplot2 - for slick graphs (Wickham 2009)
- plotly - fancy, zoomable slick graphs (Sievert et al. 2016)
- knitr - to create this document (Xie 2016)
References
Dowle, M, A Srinivasan, T Short, S Lianoglou with contributions from R Saporta, and E Antonyan. 2015. Data.table: Extension of Data.frame. https://CRAN.R-project.org/package=data.table.
Gentry, Jeff. n.d. TwitteR: R Based Twitter Client. http://lists.hexdump.org/listinfo.cgi/twitter-users-hexdump.org.
Grolemund, Garrett, and Hadley Wickham. 2011. “Dates and Times Made Easy with lubridate.” Journal of Statistical Software 40 (3): 1–25. http://www.jstatsoft.org/v40/i03/.
R Core Team. 2016. R: A Language and Environment for Statistical Computing. Vienna, Austria: R Foundation for Statistical Computing. https://www.R-project.org/.
Sievert, Carson, Chris Parmer, Toby Hocking, Scott Chamberlain, Karthik Ram, Marianne Corvellec, and Pedro Despouy. 2016. Plotly: Create Interactive Web Graphics via ’Plotly.js’. https://CRAN.R-project.org/package=plotly.
Wickham, Hadley. 2009. Ggplot2: Elegant Graphics for Data Analysis. Springer-Verlag New York. http://ggplot2.org.
Wickham, Hadley, Jim Hester, and Romain Francois. 2016. Readr: Read Tabular Data. https://CRAN.R-project.org/package=readr.
Xie, Yihui. 2016. Knitr: A General-Purpose Package for Dynamic Report Generation in R. https://CRAN.R-project.org/package=knitr.