Testing drake
Using NZ Electricity Authority grid level generation data
Ben Anderson (Contact: b.anderson@soton.ac.uk, @dataknut)
Last run at: 2020-05-07 15:18:46
1 Introduction
Use the drake (Landau 2019) R package to make data flow, analysis and reporting pipelines. Drake looks after which bits of the pipeline need refreshing every time you re-run the drake plan. So when you run the report as part of your plan (see drake.R), you can readd the objects you created in the R script to report them in this .Rmd file.
Very useful posts on drake:
2 Data
For example, in Table 2.1 we drake::readd NZ Electricity Authority generation data for June 2018 which we downloaded in drake.R from https://www.emi.ea.govt.nz/Wholesale/Datasets/Generation/Generation_MD/201806_Generation_MD.csv and present a summary.
# readd the data object

dt <- drake::readd(data)

t <- summary(dt)

kableExtra::kable(t, caption = "Data summary") %>%
kable_styling()| Site_Code | POC_Code | Nwk_Code | Gen_Code | Fuel_Code | Tech_Code | Trading_date | Time_Period | kWh | rTime | rDate | rDateTime | |
|---|---|---|---|---|---|---|---|---|---|---|---|---|
| Length:106500 | Length:106500 | Length:106500 | Length:106500 | Length:106500 | Length:106500 | Min. :2018-06-01 | TP1 : 2130 | Min. : 0 | Length:106500 | Min. :2018-06-01 | Min. :2018-06-01 00:15:00 | |
| Class :character | Class :character | Class :character | Class :character | Class :character | Class :character | 1st Qu.:2018-06-08 | TP2 : 2130 | 1st Qu.: 5376 | Class1:hms | 1st Qu.:2018-06-08 | 1st Qu.:2018-06-08 12:07:30 | |
| Mode :character | Mode :character | Mode :character | Mode :character | Mode :character | Mode :character | Median :2018-06-15 | TP3 : 2130 | Median : 17757 | Class2:difftime | Median :2018-06-15 | Median :2018-06-16 00:00:00 | |
| NA | NA | NA | NA | NA | NA | Mean :2018-06-15 | TP4 : 2130 | Mean : 36137 | Mode :numeric | Mean :2018-06-15 | Mean :2018-06-16 00:00:00 | |
| NA | NA | NA | NA | NA | NA | 3rd Qu.:2018-06-23 | TP5 : 2130 | 3rd Qu.: 46740 | NA | 3rd Qu.:2018-06-23 | 3rd Qu.:2018-06-23 11:52:30 | |
| NA | NA | NA | NA | NA | NA | Max. :2018-06-30 | TP6 : 2130 | Max. :397494 | NA | Max. :2018-06-30 | Max. :2018-06-30 23:45:00 | |
| NA | NA | NA | NA | NA | NA | NA | (Other):93720 | NA’s :4260 | NA | NA | NA’s :4260 |
3 Plot
Now we drake::readd a plot we made using the data. Note that we don’t build the plot in the .Rmd file (via knitr) we just bring back the object from wherever drake stored it and present it as Figure 3.1.
p <- drake::readd(profilePlot) # we don't need to create the p but this would let us add stuff to the plot

p
## Warning: Removed 7 rows containing missing values (position_stack).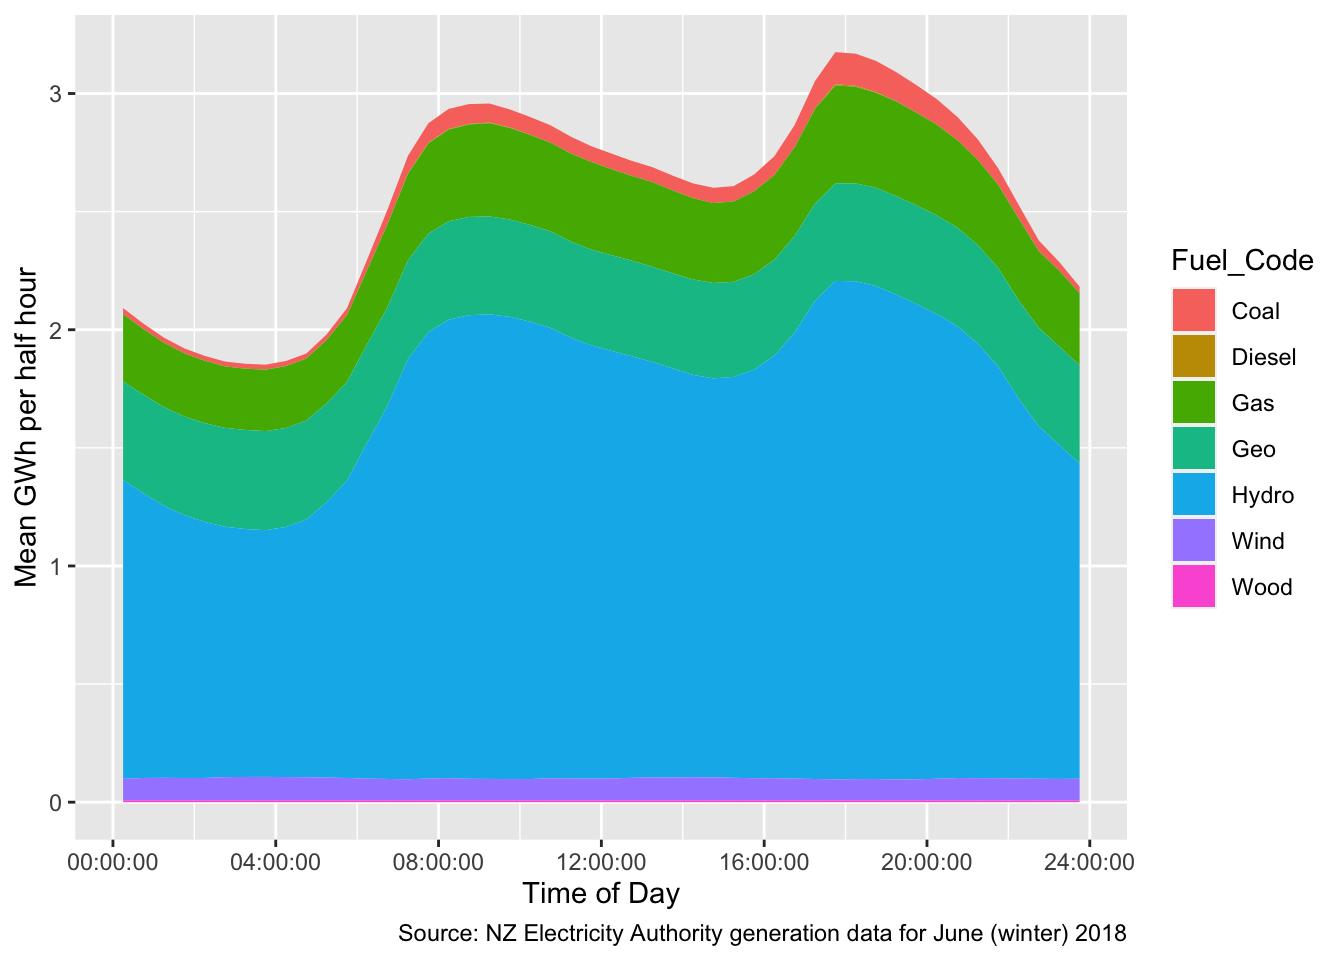
Figure 3.1: Mean electricity generation in GWh per half hour for New Zealand in June (winter) 2018
As you can see NZ generally uses hydro electricity to meet it’s winter peaks with infrequent coal & gas peaking where needed.
4 Why does it matter?
This is all really rather cool…
But the very cool bit is that if we make some changes to the code that makes the plot, when we re-make our drake plan, drake will only re-build the plot and the report. It will not go and get the data again - it knows we didn’t change the code that got the data so it leaves it alone. This means you can run the data loading process once and never have to repeat it no matter how many times you edit the subsequent R code or the .Rmd. This makes a huge difference to overall runtime for repeat report knits (for example)…
5 R environment
Packages used:
- curl (Ooms 2019)
- data.table (Dowle et al. 2015)
- drake (Landau 2019)
- ggplot2 (Wickham 2009)
- kableExtra (Zhu 2018)
- lubridate (Grolemund and Wickham 2011)
References
Dowle, M, A Srinivasan, T Short, S Lianoglou with contributions from R Saporta, and E Antonyan. 2015. Data.table: Extension of Data.frame. https://CRAN.R-project.org/package=data.table.
Grolemund, Garrett, and Hadley Wickham. 2011. “Dates and Times Made Easy with lubridate.” Journal of Statistical Software 40 (3): 1–25. http://www.jstatsoft.org/v40/i03/.
Landau, William Michael. 2019. Drake: A Pipeline Toolkit for Reproducible Computation at Scale. https://CRAN.R-project.org/package=drake.
Ooms, Jeroen. 2019. Curl: A Modern and Flexible Web Client for R. https://CRAN.R-project.org/package=curl.
Wickham, Hadley. 2009. Ggplot2: Elegant Graphics for Data Analysis. Springer-Verlag New York. http://ggplot2.org.
Zhu, Hao. 2018. KableExtra: Construct Complex Table with ’Kable’ and Pipe Syntax. https://CRAN.R-project.org/package=kableExtra.